// hi, i'm
John Itopa ISAH
DevOps & Cloud Engineer
DevOps & Cloud Engineer with hands-on experience designing and deploying production-grade infrastructure on Kubernetes. I build end-to-end systems — from containerised microservices and CI/CD pipelines to secret management, TLS automation and observability — with a strong focus on reliability, scalability and operational simplicity.
Latest from the Blog
2 articles · latest 12 days ago
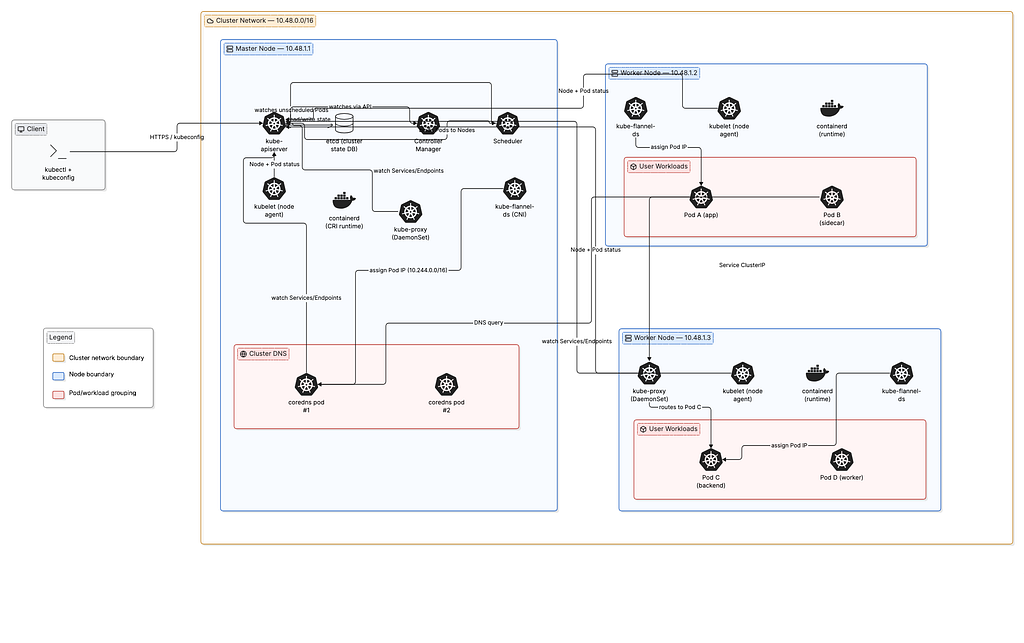
What Really Happens Inside a Kubernetes Cluster
Running kubectl apply -f deployment.yaml feels like a single action. In reality, it kicks off a chain of independent controllers — each one watching for a specific kind of change and reacting to it — that ends with containers running on a machine you never specified, reachable…
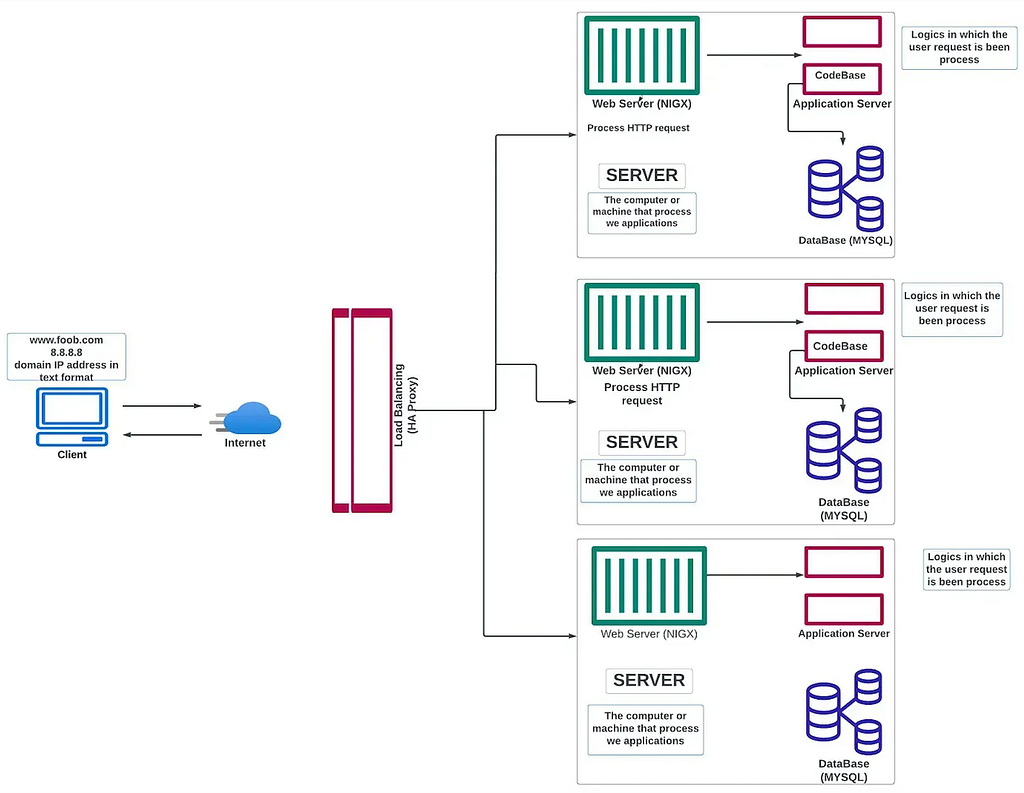
What Really Happens When You Type a URL Into Your Browser
Typing www.google.com into a browser and hitting Enter feels instantaneous — a page appears in a fraction of a second. Underneath that fraction of a second, though, is a chain of independent systems — caches, name servers, routers, firewalls, load balancers, application server…
Projects
Things I've built
Portfolio CMS — Cloud-Native Portfolio Platform
A production-grade microservices portfolio platform designed, built and deployed from scratch on a bare-metal Kubernetes cluster. Architecture: 4 fully containerised services — a public-facing Next.js 14 portfolio (user-ui), a private Next.js 14 CMS (admin-ui), a Node.js/Express REST API, and a PostgreSQL 16 database — all communicating over an internal Kubernetes network. Infrastructure & DevOps: Multi-stage CI/CD pipelines via GitHub Actions automatically build, lint, typecheck and push Docker images to GHCR on every release. Secrets are managed at runtime via the Infisical Kubernetes operator, eliminating hardcoded credentials. TLS certificates are auto-provisioned via cert-manager and Let's Encrypt. Ingress is handled by Nginx with routing rules for 3 subdomains. Email & Notifications: Professional custom-domain email at [email protected] via Zoho Mail Lite with full SPF, DKIM and DMARC configuration. Contact form submissions trigger 3 parallel notifications — an owner alert email, an automated sender acknowledgement, and an SMS via Twilio — all fire-and-forget using Promise.allSettled so no notification failure can block a user's form submission. Security: JWT-based admin authentication, bcrypt password hashing, rate limiting on public endpoints, runtime secret injection, and a dedicated password reset flow with time-limited single-use tokens. DNS: Fully managed on Cloudflare with records for A, MX, CNAME, SPF, DKIM and DMARC across the apex domain and subdomains.
Portfolio MCS — GitOps CI/CD Deployment Platform
Portfolio MCS implements a complete production-style GitOps CI/CD and Kubernetes deployment workflow designed to automate the entire software delivery lifecycle — from source code commit to live deployment inside a Kubernetes cluster. The infrastructure was designed to simulate real-world DevOps and platform engineering practices used in modern cloud-native environments. The platform architecture is divided into multiple independent services including: - portfolio-user-ui - portfolio-admin-ui - portfolio-api - portfolio-jobs - portfolio-db Each service is isolated, containerized, independently versioned, and deployed separately through automated GitOps workflows. The CI/CD process starts from GitHub repositories where all application source code, Kubernetes manifests, and deployment configurations are stored. Whenever new code is pushed to the repository, GitHub Actions automatically triggers the deployment pipeline. The CI/CD workflow is designed as a multi-service deployment pipeline where each service has its own validation, build, publish, and deployment stages. The pipeline performs: - source code validation - dependency installation - linting and type checking - Docker image builds - semantic image tagging - container publishing to GitHub Container Registry (GHCR) - Kubernetes manifest updates - deployment synchronization The pipeline architecture is organized using GitHub Actions workflows that execute multiple jobs in parallel to optimize deployment speed and service isolation. Separate pipeline stages exist for: - API service - User UI - Admin UI - Database layer - Job workers Each service build produces a versioned Docker container image. Images are tagged dynamically using release versions such as: - v0.1.0-rc1 - v0.1.0-rc2 - latest The generated images are automatically pushed to GitHub Container Registry (GHCR), creating a centralized private/public image repository for Kubernetes deployments. This allows Kubernetes clusters to pull immutable production-ready images directly from GHCR during deployments. After container publishing, the CI/CD workflow automatically updates Kubernetes deployment manifests stored inside the GitOps repository. These manifests contain: - Deployments - Services - ConfigMaps - Secrets references - StatefulSets - Horizontal Pod Autoscalers - CronJobs - RBAC resources - PersistentVolumeClaims - Ingress resources The deployment manifests are updated dynamically with the new container image versions generated during the build pipeline. This creates a fully automated release workflow where infrastructure state is continuously updated directly from CI/CD pipelines. The platform follows GitOps deployment principles using ArgoCD as the continuous delivery engine. ArgoCD continuously monitors the Git repository for infrastructure or manifest changes. Once the CI/CD workflow commits updated image versions to the repository, ArgoCD automatically detects the drift between Git state and cluster state. ArgoCD then performs: - automated synchronization - rolling deployments - rollout management - deployment reconciliation - health verification - application monitoring This creates a declarative deployment model where Git becomes the single source of truth for both infrastructure and application delivery. The Kubernetes infrastructure itself is designed as a cloud-native orchestration environment responsible for: - container scheduling - service discovery - pod orchestration - scaling - self-healing - rolling updates - workload isolation The user interface, admin dashboard, API, and workers are deployed as Kubernetes Deployments with replica management enabled. Kubernetes automatically recreates failed pods and maintains desired replica counts for high availability. The PostgreSQL database layer is deployed using StatefulSets and PersistentVolumeClaims to provide stable network identities and persistent storage across container restarts. Persistent storage ensures database durability and state preservation during rolling updates or node failures. The jobs subsystem runs asynchronous background processing workloads inside Kubernetes CronJobs and worker pods. These workloads automate: - job ingestion - AI-based filtering - application tracking - email processing - follow-up reminders - scheduled automation tasks Horizontal Pod Autoscalers (HPA) are configured to support workload scaling based on resource utilization. This allows services to scale dynamically depending on traffic or processing demand. Configuration management is handled using Kubernetes ConfigMaps and Secrets, separating runtime configuration from application code. Sensitive environment variables and credentials are isolated securely from deployment manifests. The networking layer uses Kubernetes Services and ingress routing to expose applications internally and externally. External traffic routing is managed using ingress controllers integrated with TLS-enabled HTTPS communication. Cloudflare DNS is used as the external DNS and edge-routing provider for: - domain resolution - HTTPS proxying - edge caching - traffic protection - DNS management The platform supports secure public endpoints including: - johnisah.com - admin.johnisah.com - argocd-deploy.johnisah.com The infrastructure includes secure TLS-enabled ingress routing for all exposed services. HTTPS traffic is terminated securely before requests are forwarded to Kubernetes workloads. ArgoCD itself is deployed inside Kubernetes and manages all application deployments using the app-of-apps GitOps pattern. A root ArgoCD application continuously manages child applications including: - portfolio-user-ui - portfolio-admin-ui - portfolio-api - portfolio-jobs - portfolio-db This architecture creates centralized deployment management while maintaining service separation and independent lifecycle management. Deployment observability and operational visibility are major parts of the system. ArgoCD provides: - application health monitoring - synchronization status - deployment history - rollback visibility - resource topology visualization - rollout tracking GitHub Actions provides: - build logs - deployment summaries - release traceability - workflow execution visibility - artifact generation - image publishing history The overall system demonstrates practical implementation of: - GitOps deployment architecture - Kubernetes orchestration - production-grade CI/CD pipelines - microservices deployment automation - container lifecycle management - declarative infrastructure delivery - cloud-native platform engineering - automated release engineering - scalable deployment workflows - Kubernetes operational management - infrastructure reliability and automation The project was intentionally designed as a real-world DevOps engineering platform rather than a simple portfolio application, with strong emphasis on automation, deployment reliability, scalability, operational visibility, infrastructure maintainability, and modern cloud-native engineering practices.
Portfolio MCS — Observability & Monitoring Stack
Production-grade observability stack running in a dedicated monitoring namespace on a 3-node Minikube cluster, providing full-stack visibility into the Portfolio MCS application from infrastructure to business metrics. Prometheus serves as the time-series data store with a 5Gi PVC, 30-day retention, and 15-second scrape intervals across 5 target groups: the Node.js API (×2 replicas on port 4000), node-exporter DaemonSet (×3 nodes), kube-state-metrics, postgres-exporter, and Prometheus itself — all targets consistently UP. Grafana exposes 6 purpose-built dashboards at grafana.johnisah.com: System Overview (at-a-glance health for all services), API Performance (request rates, P95/P99 latency, error rates per route), Database Health (cache hit ratio, active connections, query duration, dead tuples), Kubernetes Infrastructure (per-node CPU/memory, pod restarts, PVC utilisation), Business Metrics (contact form submissions, auth events, content activity), and Alerts & SLO (error budget burn rate, availability SLO tracking). Alertmanager routes alert emails to [email protected] via Zoho SMTP with 5 configured rules: APIDown, HighErrorRate (≥5% threshold), DBCacheHitLow, NodeHighMemory, and PodCrashLooping. The Node.js API exposes 14 custom business metrics via prom-client through a dedicated metrics middleware, tracking HTTP request totals and duration histograms, active connections, database query counts, and contact form submission rates — all accessible at /metrics on port 4000. All secrets (Grafana admin credentials, SMTP password, PostgreSQL DSN for the monitoring user) are managed zero-trust via the Infisical operator using InfisicalSecret CRDs — nothing stored in git. Kubernetes NetworkPolicies enforce that only Prometheus pods in the monitoring namespace can reach port 4000 on the API pods.
ShopNow — E-Commerce Microservices Platform
A production-grade e-commerce platform built as a cloud-native microservices architecture — from zero to Kubernetes in production. The platform consists of three services: a Django REST API backend, a Next.js customer storefront, and a Next.js admin dashboard — all containerised with Docker and orchestrated on Kubernetes. Key highlights: - Full e-commerce flow — product browsing, Redis-backed basket, Stripe payments, order management, and email activation - Zero secrets in git — Infisical operator syncs encrypted secrets directly into the Kubernetes cluster - GitOps deployment — ArgoCD watches the Helm chart in git and auto-deploys on every push - Automatic HTTPS — cert-manager provisions and renews Let's Encrypt TLS certificates - CI/CD pipelines — GitHub Actions tests, builds, scans with Trivy, and pushes Docker images to Docker Hub - Data safety — PostgreSQL StatefulSet with PVC using Retain reclaim policy survives pod crashes and helm uninstalls - Next.js API proxy — server-side rewrites replace NEXT_PUBLIC_API_URL so the same Docker image works on any host without rebuilding
k8s-mcp-assistant — Kubernetes MCP Server
A read-only Kubernetes Model Context Protocol (MCP) server that gives AI assistants like Claude full cluster inspection capabilities through natural language. Built entirely in Python, the server exposes 23 MCP tools covering every major Kubernetes read operation — pods, deployments, statefulsets, daemonsets, replicasets, jobs, cronjobs, services, events, nodes, namespaces, cluster version and all API resources. Key design decisions: - Read-only by default — no mutations ever possible - Namespace-restricted or cluster-wide access via environment variable configuration - Kubeconfig loaded once at startup (cached) rather than per request, eliminating repeated I/O overhead - Consistent JSON response envelope {ok, data} or {ok, error_type, message} across all tools - Full Pydantic response models for every resource type - 85 unit tests using unittest.mock — no live cluster required to run the test suite The server was developed and tested against both a local minikube cluster and an AWS EKS cluster. During development it was used to diagnose real cluster issues — including an ImagePullBackOff caused by nodes in private subnets without NAT Gateway or ECR VPC endpoints, and a CNI IP exhaustion failure on the aws-node DaemonSet. Integrated with Claude Desktop via the MCP protocol, allowing Claude to inspect any Kubernetes cluster in plain English — listing pods, reading logs, describing nodes, checking deployment rollout status, and diagnosing failures — all without leaving the chat interface.
Skills
Technologies I work with
CI/CD
Cloud
Cloud Native Computing
Infrastructure as Code
Experience
Where I've worked
DevOps Engineer Intern
Quandela
Management and orchestration of Kubernetes workloads using Helm, including configuration of deployments, services, and Ingress, as well as monitoring with Prometheus and Grafana to improve application availability, reliability, and scalability.
Design and implementation of CI/CD pipelines with GitLab CI and Argo CD to automate integration, testing, Docker image builds, and continuous deployment of containerized applications following a GitOps approach.
Provisioning and management of cloud infrastructure on AWS and OVH using Terraform and Ansible, covering network, compute, and security resources to ensure environment consistency, reproducibility, and deployment automation.
Software Engineer
Dataville Research LLC
Design and development of a fullstack application with Angular for the frontend and Flask (Python) for the backend, exposing REST APIs and deployed on Google Cloud Platform (GCE) with Nginx, DNS, and HTTPS (SSL) configuration, and integration of a PostgreSQL database containerised with Docker and Docker Compose.
Development of web interfaces with Angular and collaboration in an Agile environment (Jira), contributing to continuous integration (CI/CD), debugging, incident resolution, and continuous application improvement.
Education
Schools & qualifications
MSc · Software Systems, Cloud Computing & Distributed Architectures
Referees
People I've worked with
Mario Valdivia
Software Engineering
Quandela
“I had the opportunity to follow his work during his internship, as I was the manager of his direct supervisor. During his internship, he worked on the deployment of cloud-based orchestration infrastructure using Kubernetes. He contributed to the implementation of a Kubernetes environment and gained solid hands-on experience with cluster configuration, deployment workflows, and operational practices. He also implemented ArgoCD to support GitOps practices, helping to improve the automation and consistency of application deployments. Through this work, he developed a good understanding of modern cloud-native infrastructure and CI/CD principles. He demonstrated strong learning ability throughout the internship. He is a quick learner, approaches technical challenges with a problem-solving mindset, and progressively gained autonomy over the course of the project. He collaborated effectively with his supervisor and team members and maintained a professional attitude. Overall, he completed a successful internship and built a solid foundation in Kubernetes and DevOps practices. I’m confident he will continue to grow as he gains further experience, and I wish him the best in the next steps of his career.”
Aditya KHOT
Cloud DevOps Engineer
Quandela
“I had the opportunity to work with John during his internship, where he contributed mainly on the deployment of cloud-based orchestration infra using kubernetes. He also implemented argoCD to support gitops practices, improving deployment automation and consistency. He is a quick learner, problem solver, adaptive mindset and collaborative. Overall, he completed his 6 months internship at Quandela successfully. I highly recommend him as a good candidate for DevOps and cloud engineer. I wish him continued success in his career.”
Contact
Let's work together
Open to DevOps roles, freelance infrastructure projects, and collaboration. I typically respond within 24 hours.
[email protected]
linkedin.com/in/johnitopaisah
github
github.com/johnitopaisah
medium
blogs.johnisah.com